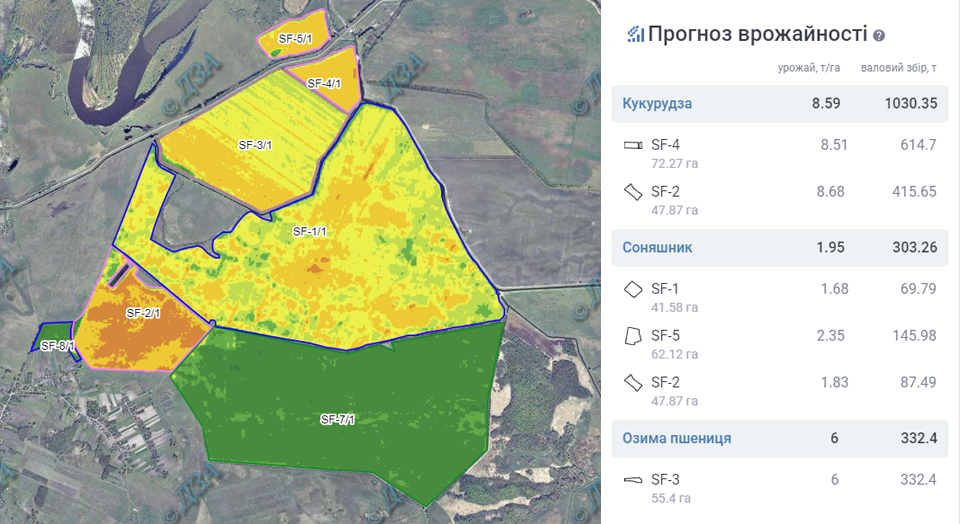
Yield forecast for each day
02.07 2020
Crop yield is a comprehensive indicator, because, on the one hand, this is the initial information for building plans and forecasts, and on the other hand, it is one of the main resulting indicators of an agricultural enterprise. Prediction of yield based on satellite data is a promising direction, because the forecasting methods used are distinguished by their objectivity, efficiency and coverage of large territories. Their main advantages include obtaining data not only in vast areas, but also in hard-to-reach areas, as well as the visibility of the information received and the possibility to re-survey the same area at the required time intervals.

The vegetation index NDVI is used as the main indicator for constructing the forecast model. As a rule, the maximum values of its dynamical series are used, which have a high correlation with productivity. Nevertheless, if we take into account only the actual maximum of vegetation, which is unevenly achieved in different years, the possibility of early forecasting, and therefore its practical value, is reduced. To avoid this, other indicators that characterize the meteorological and climatic features of the region under study are taken into account. The more complete and reliable the information entered into the system for analysis, the more accurate the forecast will be. As a result of studying data on the significance and strength of their impact on productivity, Soft.Farm in its calculations takes into account the variety and predecessor of the crop, the dates of sowing and harvesting, the actual yield, as well as the amount of precipitation and the sum of active temperatures over the past year and from the beginning of this year.

At the first stage of forecasting, it is necessary to study the variability of the vegetation index NDVI at different time periods, and also to calculate its average long-term dynamics, which is used for a comparative assessment of the condition of crops. When calculating the values, pre-processed data on sown areas and gross yield crop are used, which directly affect the accuracy of the forecasting model. Onwards, for the selected territories, dynamic series of NDVI values are formed for the specific field and the corresponding agricultural crop. The Soft.Farm web service has a large statistical platform for the interdependence of the state of crops and productivity, which is 2,500,000 ha throughout Ukraine. The system compares the vegetation index with similar graphs in the database and updates the forecast every time a new satellite image appears.

The use of forecasting results allows the agricultural enterprise to estimate the amount of future income from its activities, which makes it possible to adjust the farm's plans for the distribution of production resources. Simply put, thanks to the yield forecast in Soft.Farm, the farmer will have a clear understanding of whether he will be able to buy a new seeder in the next agricultural season or whether he will have to spend money on other measures aimed at increasing the yield.
Given the importance of forecasting, now this module is located on the main page of the web service and is another tool to increase the efficiency of managerial decision-making.
Back to news list